Analysis Modes

This website provides two analysis modes:
- Group Comparison: Define groups based on health examination data and compare their eccDNA profiles.
- Specific eccDNA Analysis: Select a specific eccDNA to investigate differences in health metrics between carriers and non-carriers, along with associated lifestyle factors.
You can switch between these modes using the button at the top center of the page.
Group Comparison Mode

-
Create groups by clicking the '+' button
-
Create One Group: If you create a single group, the system will compare it with its complementary group (i.e., the rest of the population).
-
Create Two Groups: If you create two groups, the system will compare these two specified groups.
-
-
Filter groups by defining health data ranges
- Set the ranges for health examination metrics to define each group.
- The right panel of the page provides a preview of the proportion of participants in each group.
-
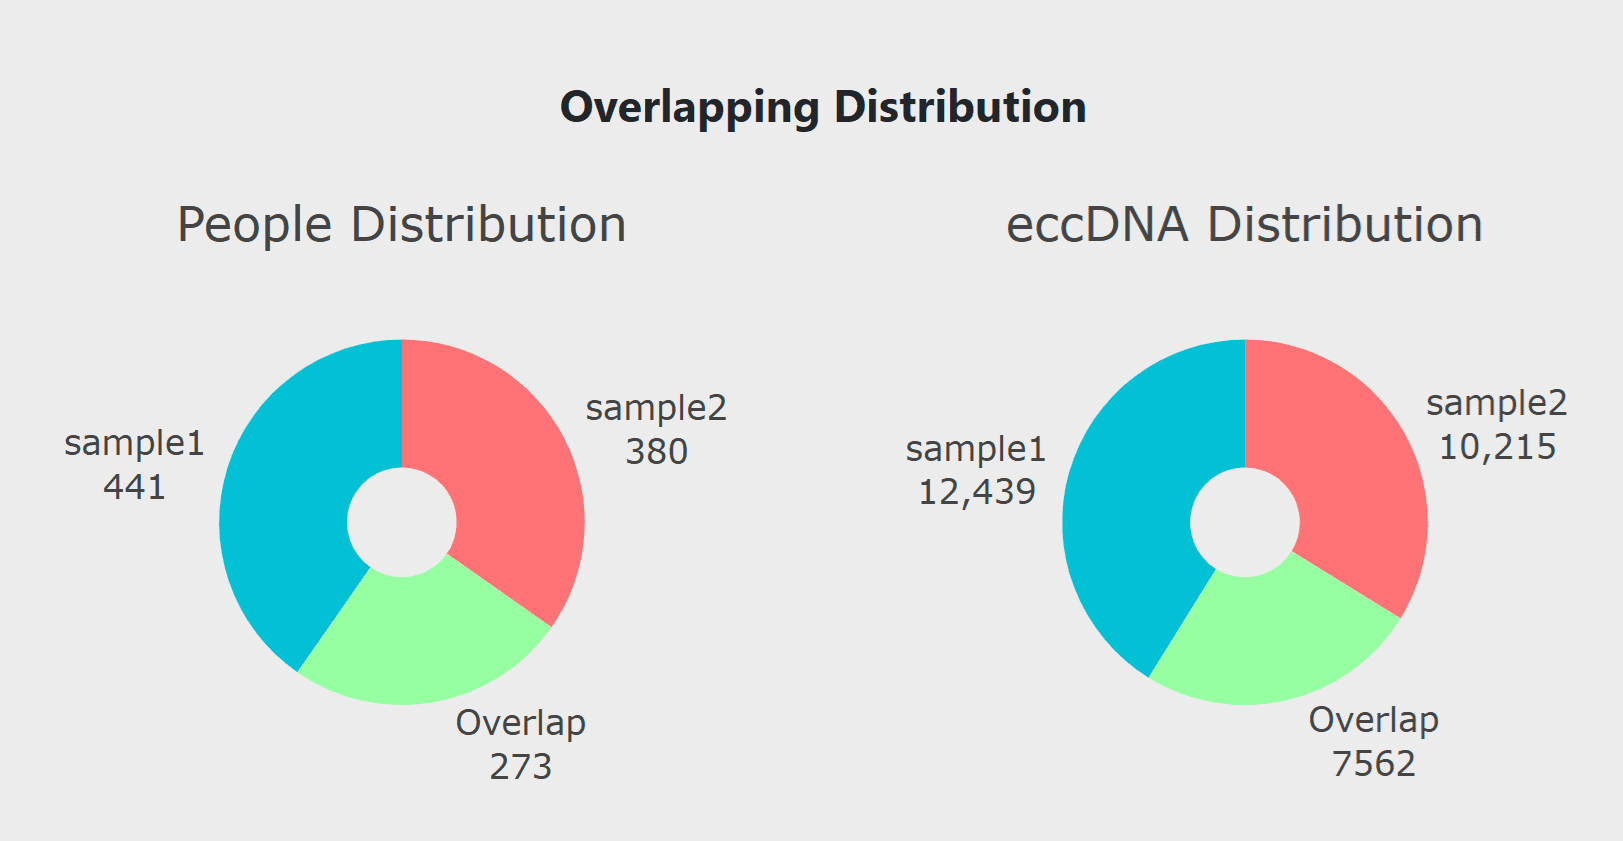
Click 'Analyze' to examine group distributions
- Click the 'Analyze' button on the right panel to generate and review the distribution of eccDNA in both groups, including any overlap between them.
-
View the results through ECDF and Top-K visualizations
- Use the ECDF plot to observe differences in eccDNA size distribution.
- The Top-K plot highlights the most prevalent eccDNAs in each group, allowing for further comparison.
- Participants present in both groups (overlapping individuals) are excluded from the Top-K analysis to ensure a clear distinction between the groups.
- If a group contains fewer than 15 participants after overlap removal, the system will not display results to prevent potential re-identification of individuals.
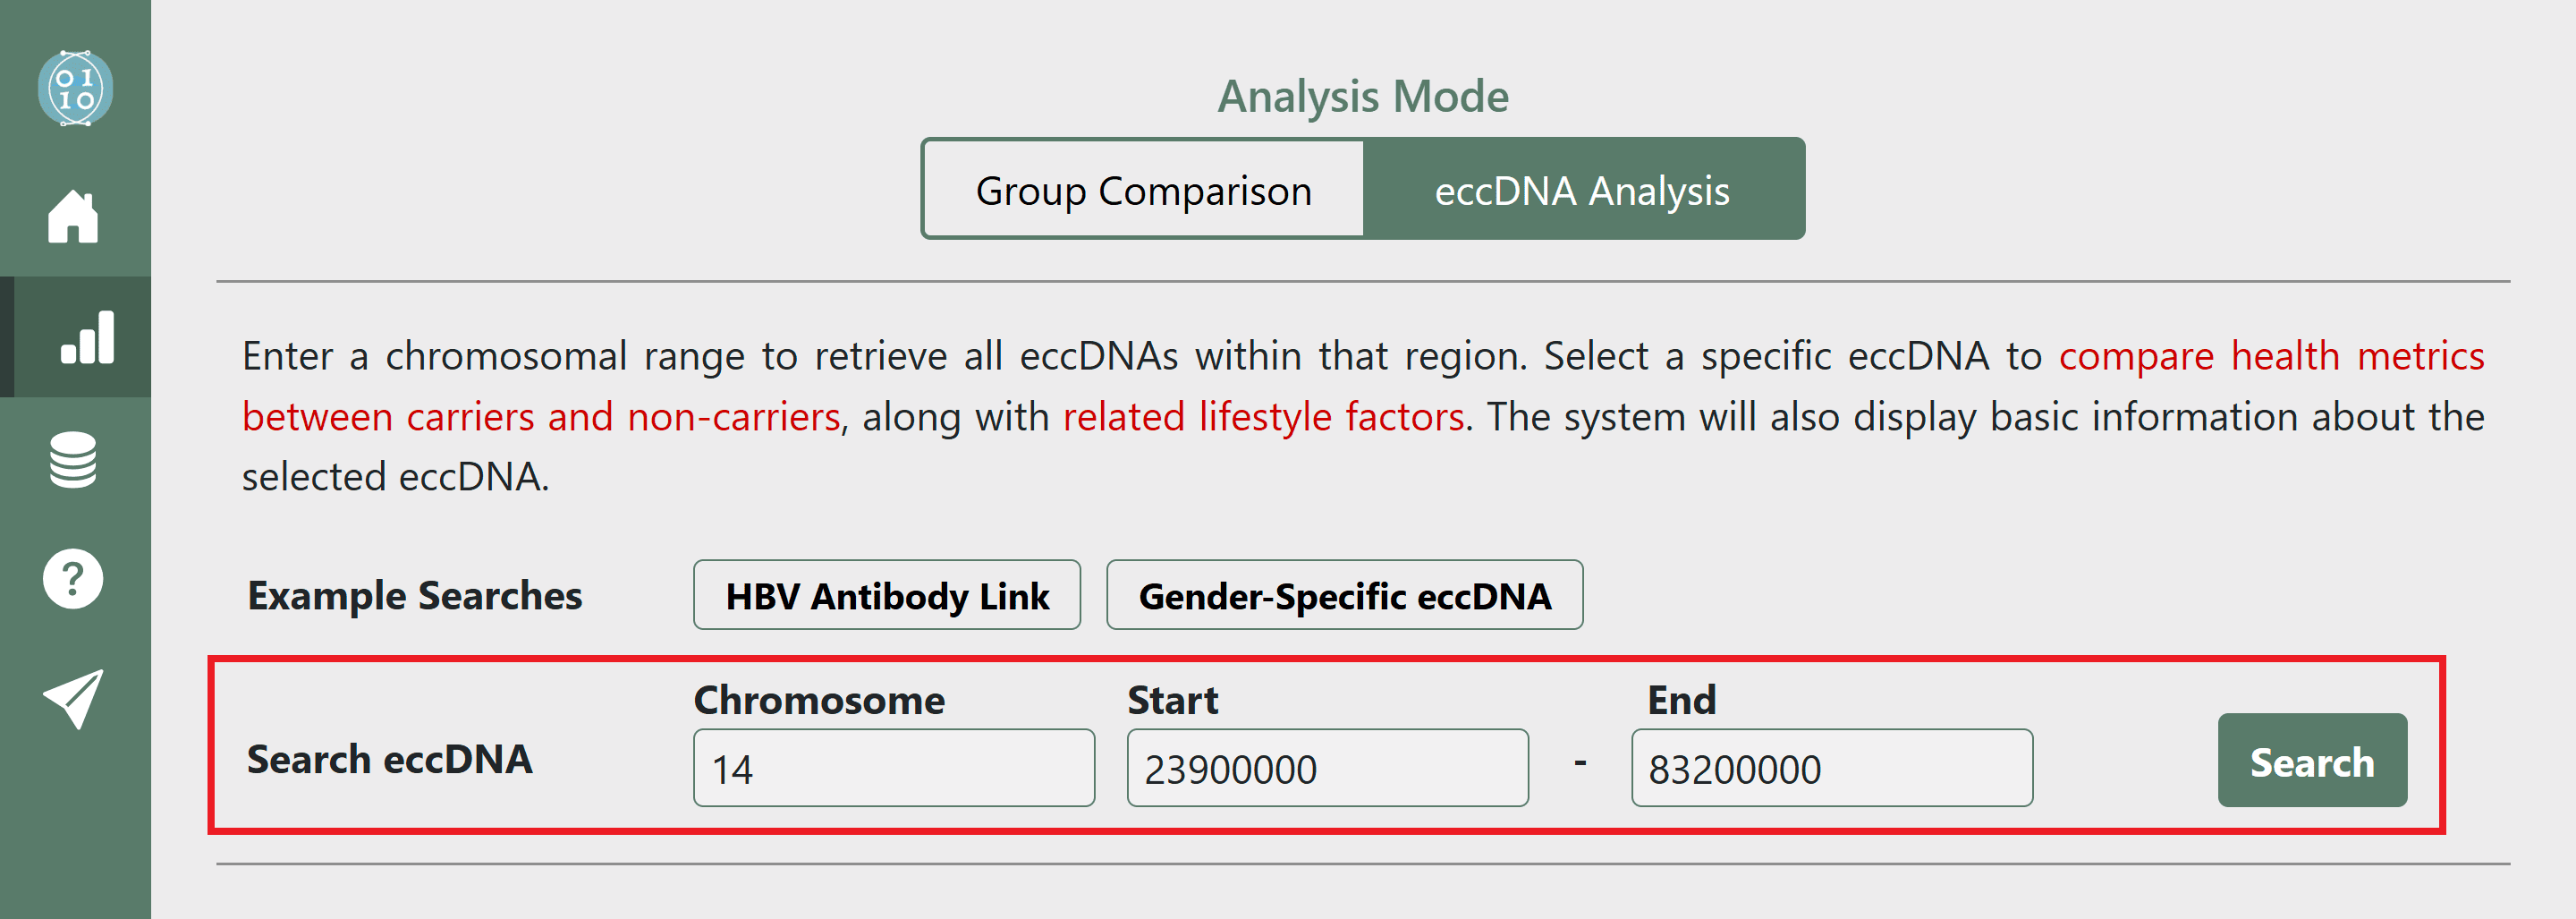
Specific eccDNA Analysis Mode
-
Enter a genomic coordinate range and click 'Search'
- The system will list all eccDNAs found within the specified range.
-
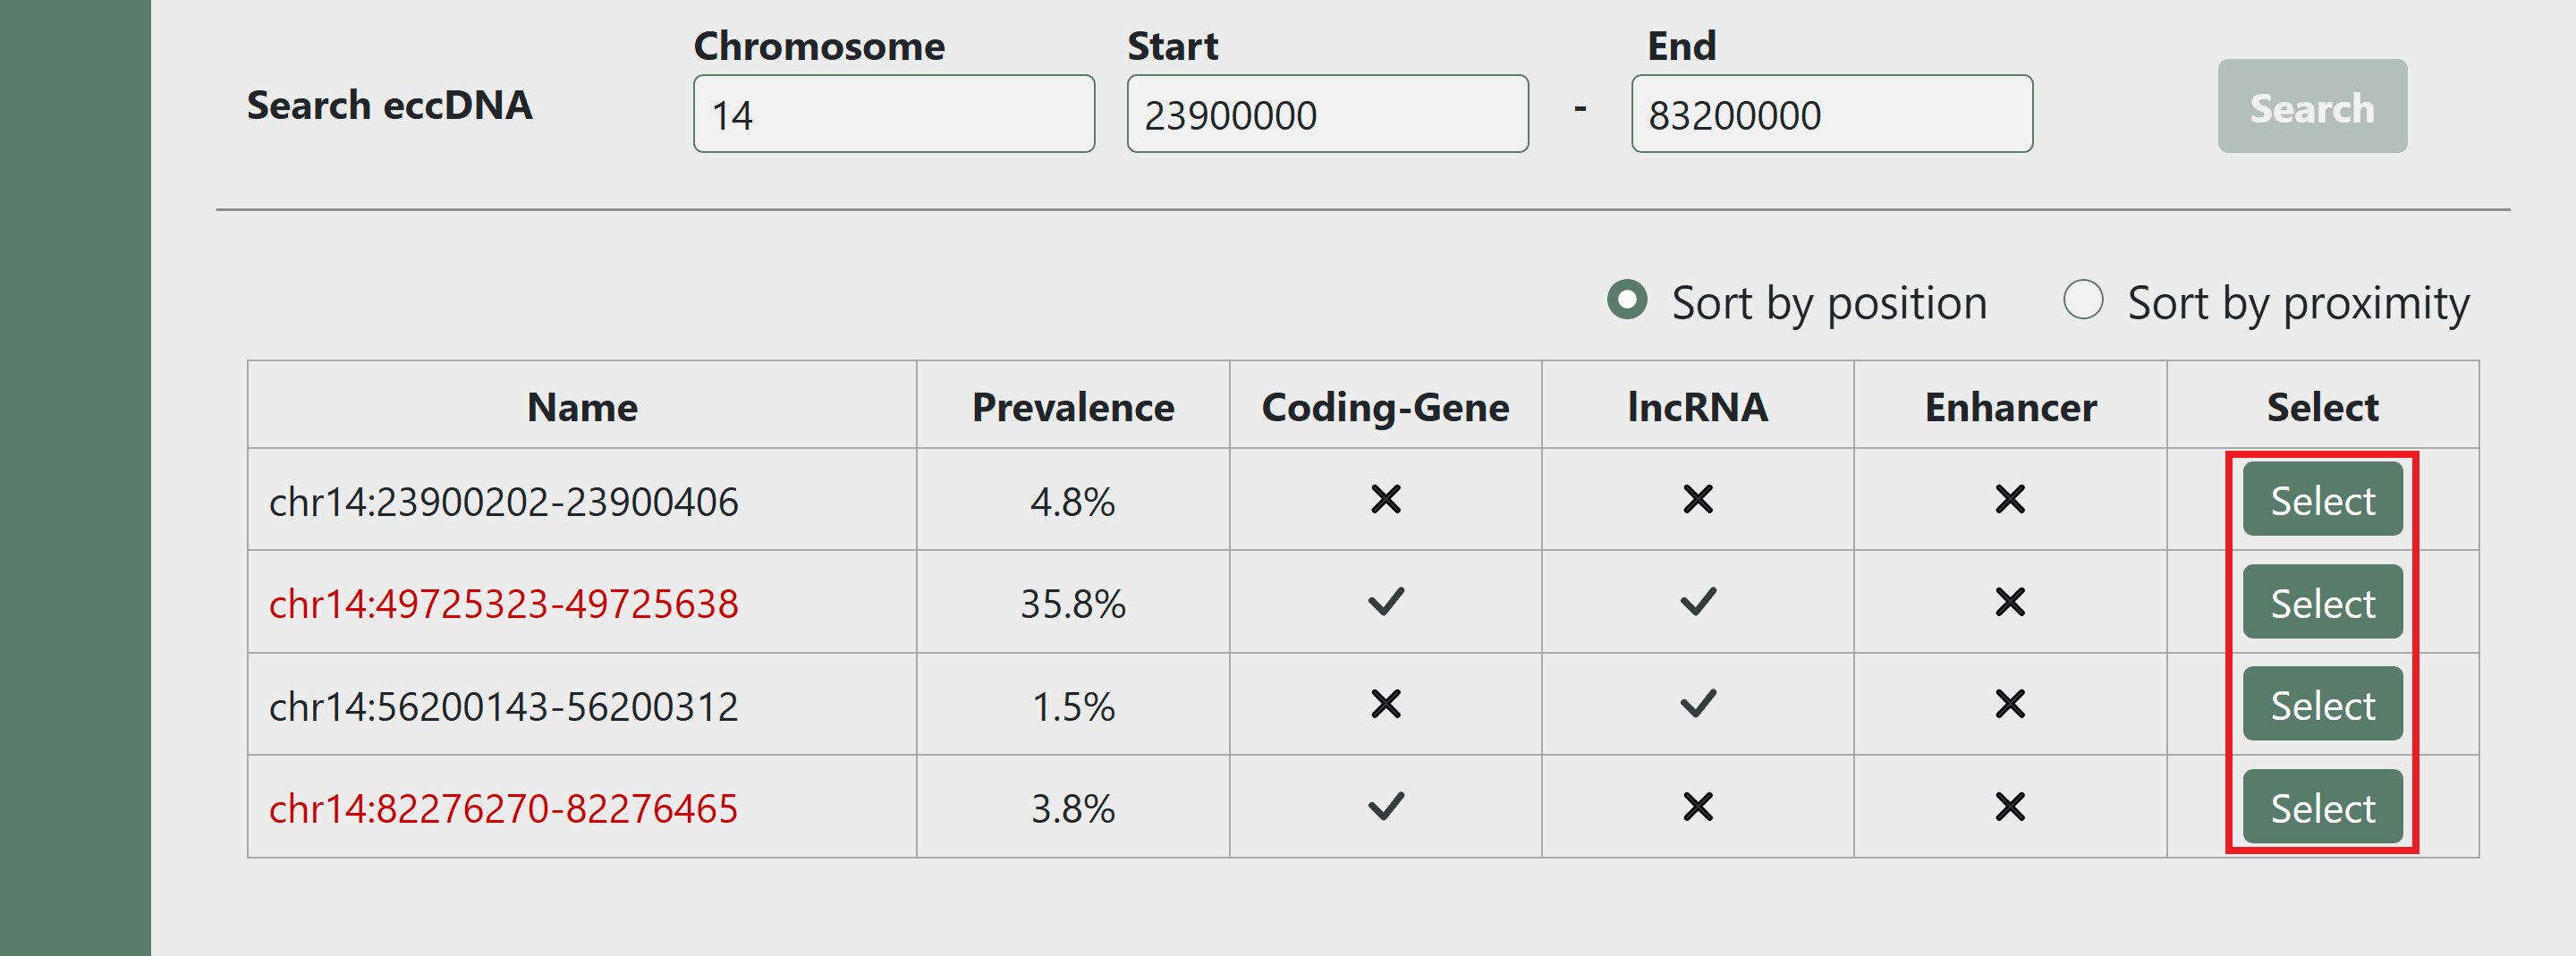
Select an eccDNA from the listed results
- "Prevalence" indicates the proportion of individuals carrying the selected eccDNA.
- If an eccDNA is displayed in red, it means a significant eccDNA-Health association has been identified.
-
Examine the association between eccDNA and health metrics
- Compare health examination data between eccDNA carriers and non-carriers to identify statistically significant differences.
- Statistical analyses are based on 1,094 participants.
-
Explore the association between health metrics and lifestyle factors
- Investigate lifestyle habits associated with health metrics that show significant differences.
- Statistical analyses are based on 142,906 participants. Due to the large dataset, P-values are generally small.